Showing posts with label FXI. Show all posts

Thursday, May 9, 2013

Real Emerging Markets

I have a large Emerging Markets allocation (18% at last count). I own broad EM ETFs and MFs. However, these broad instruments suffer from the problem of being heavily concentrated in just a few markets. For example - VWO has the following composition:

China - 18%, S. Korea 14%, Brazil 12%, Taiwan 10%, S. Africa 8%, India 7%, Mexico 5%, Russia 5%

Now, of the above, many are so well invested that they can hardly be considered "Emerging". Especially S. Korea and Taiwan seem like almost at their peak potential - already "Emerged" so to speak. These are rich countries with GDP per-capita of $31K and $38K respectively - they really should be moved to Developed Ex-US category (EFA) already.

In my view, for a country to be considered "Emerging", the country should be first, relatively less affluent so that a higher growth trajectory is feasible and second, politically and socially stable so that the higher growth trajectory is realizable. With that in mind, I propose the following heuristics

  1. GDP Per-Capita below either the world average ($11.5K) or the neighborhood average
  2. A minimum economy size of $300B
  3. Politically and socially stable. I have ranked the countries on a scale from 1 (Unstable) to 5 (Stable)
Using the criteria above, we get the following list (ordered by the size of the economy):

#  Country   GDP ($T)  GDP Per Capita ($)  Stability Rating  ETF
1  China     12.4         8.4K                  3            FXI
2  India      4.7         3.7K                  4            EPI
3  Russia     3.0        16.7K                  3            RSX
4  Brazil     2.3        11.8K                  4            EWZ
5  Mexico     1.8        14.7K                  4            EWW
6  Indonesia  1.2         4.7K                  3            EIDO
7  Turkey     1.1        14.4K                  4            TUR
8  Iran       1.0        13.2K                  2
9  Thailand   0.6         9.4K                  3            THD
10 S. Africa  0.6        11.0K                  3            EWA
11 Egypt      0.5         6.5K                  1
13 Pakistan   0.5         2.8K                  2
14 Colombia   0.5        10.2K                  2
15 Philippines0.4         4.0K                  3            EPHE
16 Nigeria    0.4         2.6K                  3            NGR
17 Ukrain     0.3         7.2K                  3            NA
18 Peru       0.3        10.0K                  4            EPU
19 Vietnam    0.3         3.4K                  3            VNM
20 Bangladesh 0.3         1.9K                  3            NA                 

So I have a list of 20 countries - of which four are unstable and hence not a good investment target at this time. Among the rest, Ukrain and Bangladesh do not have a country ETF readily available. So that leaves 14 investable targets. My plan is to take long term positions in all of these - positions that I hold for 20+ years while these countries work through their growth pangs. I have already taken positions in all of them except THD, EPHE, EPU and VNM (the bold in table above represents a long position). My current position in NGR is tentative considering the extremely low volumes that it has.

I know that not all of the above holdings are going to work out - but I think I have a better distribution this way than the VWO folks - and hence a better shot at capturing the future growth in the emerging (or poorer, by my definition) economies shown above. Now, fingers crossed and let the long wait begin.

Today's art is my favorite part of Sistine Chapel Ceiling - The Libyan Sybil. I found these small Sybil paintings much more engrossing than the really-well-composed-but-somehow-feeling-quite-empty Creation of Adam.

Wednesday, December 5, 2012

Trades: Buy EPI, Buy FXI, Buy F

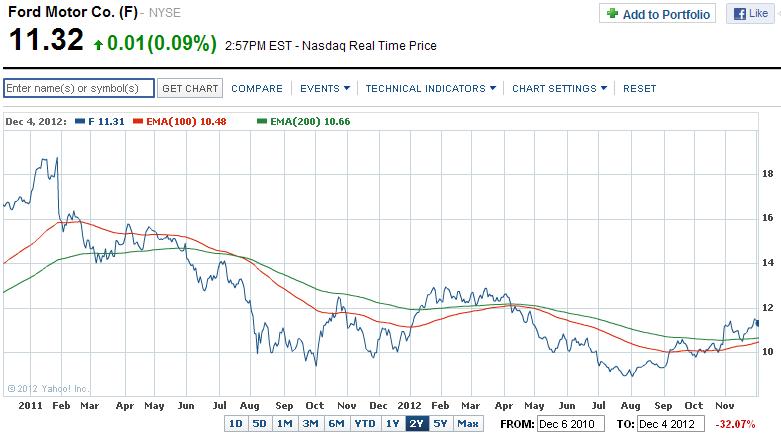
I have three units of cash that I wanted to invest in three stocks/ETFs that I can hold for a reasonable long term. Long term is a relative word here - I will not be looking at 3 month charts here like I used to for trend trading, but more like 2 year charts with the focus on 100 DEMA and 200 DEMA.

They are essentially part of the Exit Strategy #4. These stocks will be benchmarked with 100 DEMA. All of these stocks show signs of turning their 100 DEMA around. The charts below provide evidence. The charts are 2 year charts to keep attention on long term trends.

First - F - Ford Motors
I am watching the red line (100 DEMA), the fact that its slope is upwards and also the fact that it is going to cross the green line (200DEMA). Exit point is when price is decisively below the 100 DEMA.


Second - FXI - China
Same situation as F above. Upward sloping 100 DEMA, about to cross through 200 DEMA. Exit point is 100 DEMA.


Lastly, EPI - India
Same as the two above. Benchmarking on Exit Strategy #4, 100 DEMA.


I am now fully invested in the markets. No cash left. Of course, many of these bets under Exit Strategy #3 and #4 will hit their triggers and will be sold - so then I will have flexibility again for new investments. For the moment though, I am fully tapped out.